HOW IT WORKS
The Vulnerability Mapping Analysis Platform (VMAP) offers users a Social Vulnerability Mapping Tool to easily measure and visualize disaster losses and human impacts through the lens of evidenced based social vulnerability factors. The VMAP social vulnerability mapping tool allows emergency managers and decisions makers to use a risk-based approach to quickly identify areas most vulnerable and focus their efforts on the critical aspects of planning. With the click of a button, VMAP applies the science of vulnerability and produces custom outputs for the area selected, saving managers the rigorous and time intensive process to manually produce the same result.
VMAP currently allows registered/logged in users to create tract level SoVI® maps at the State, County, City, Congressional District, and Watershed level or a user defined region may be uploaded in the form of a shapefile. Multiples of each area of interest can also be selected. Future plans for VMAP will support other social vulnerability models.
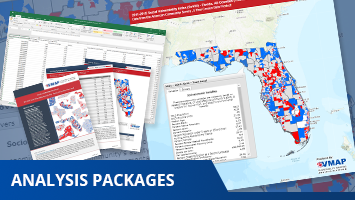
A variety of analysis packages are offered to provide emergency managers with exactly what is needed to begin planning. Options include interactive web maps, a custom vulnerability report, downloadable image files, a shapefile for offline use in your GIS tool of choice, and the factor score data.

Take a look at the following examples of what is available within an analysis package: